
How do you prove the value of your Design System
How do you track adoption in a way that reflects what real users actually experience
At the Into Design Systems Conference, Stefano Magni, Tech Lead for the Preply Design System, shared one of the most advanced answers I have seen:
Visual Coverage.
It goes far beyond counting components in Figma.
It measures how much of your live product is truly built with Design System components.
What is Visual Coverage
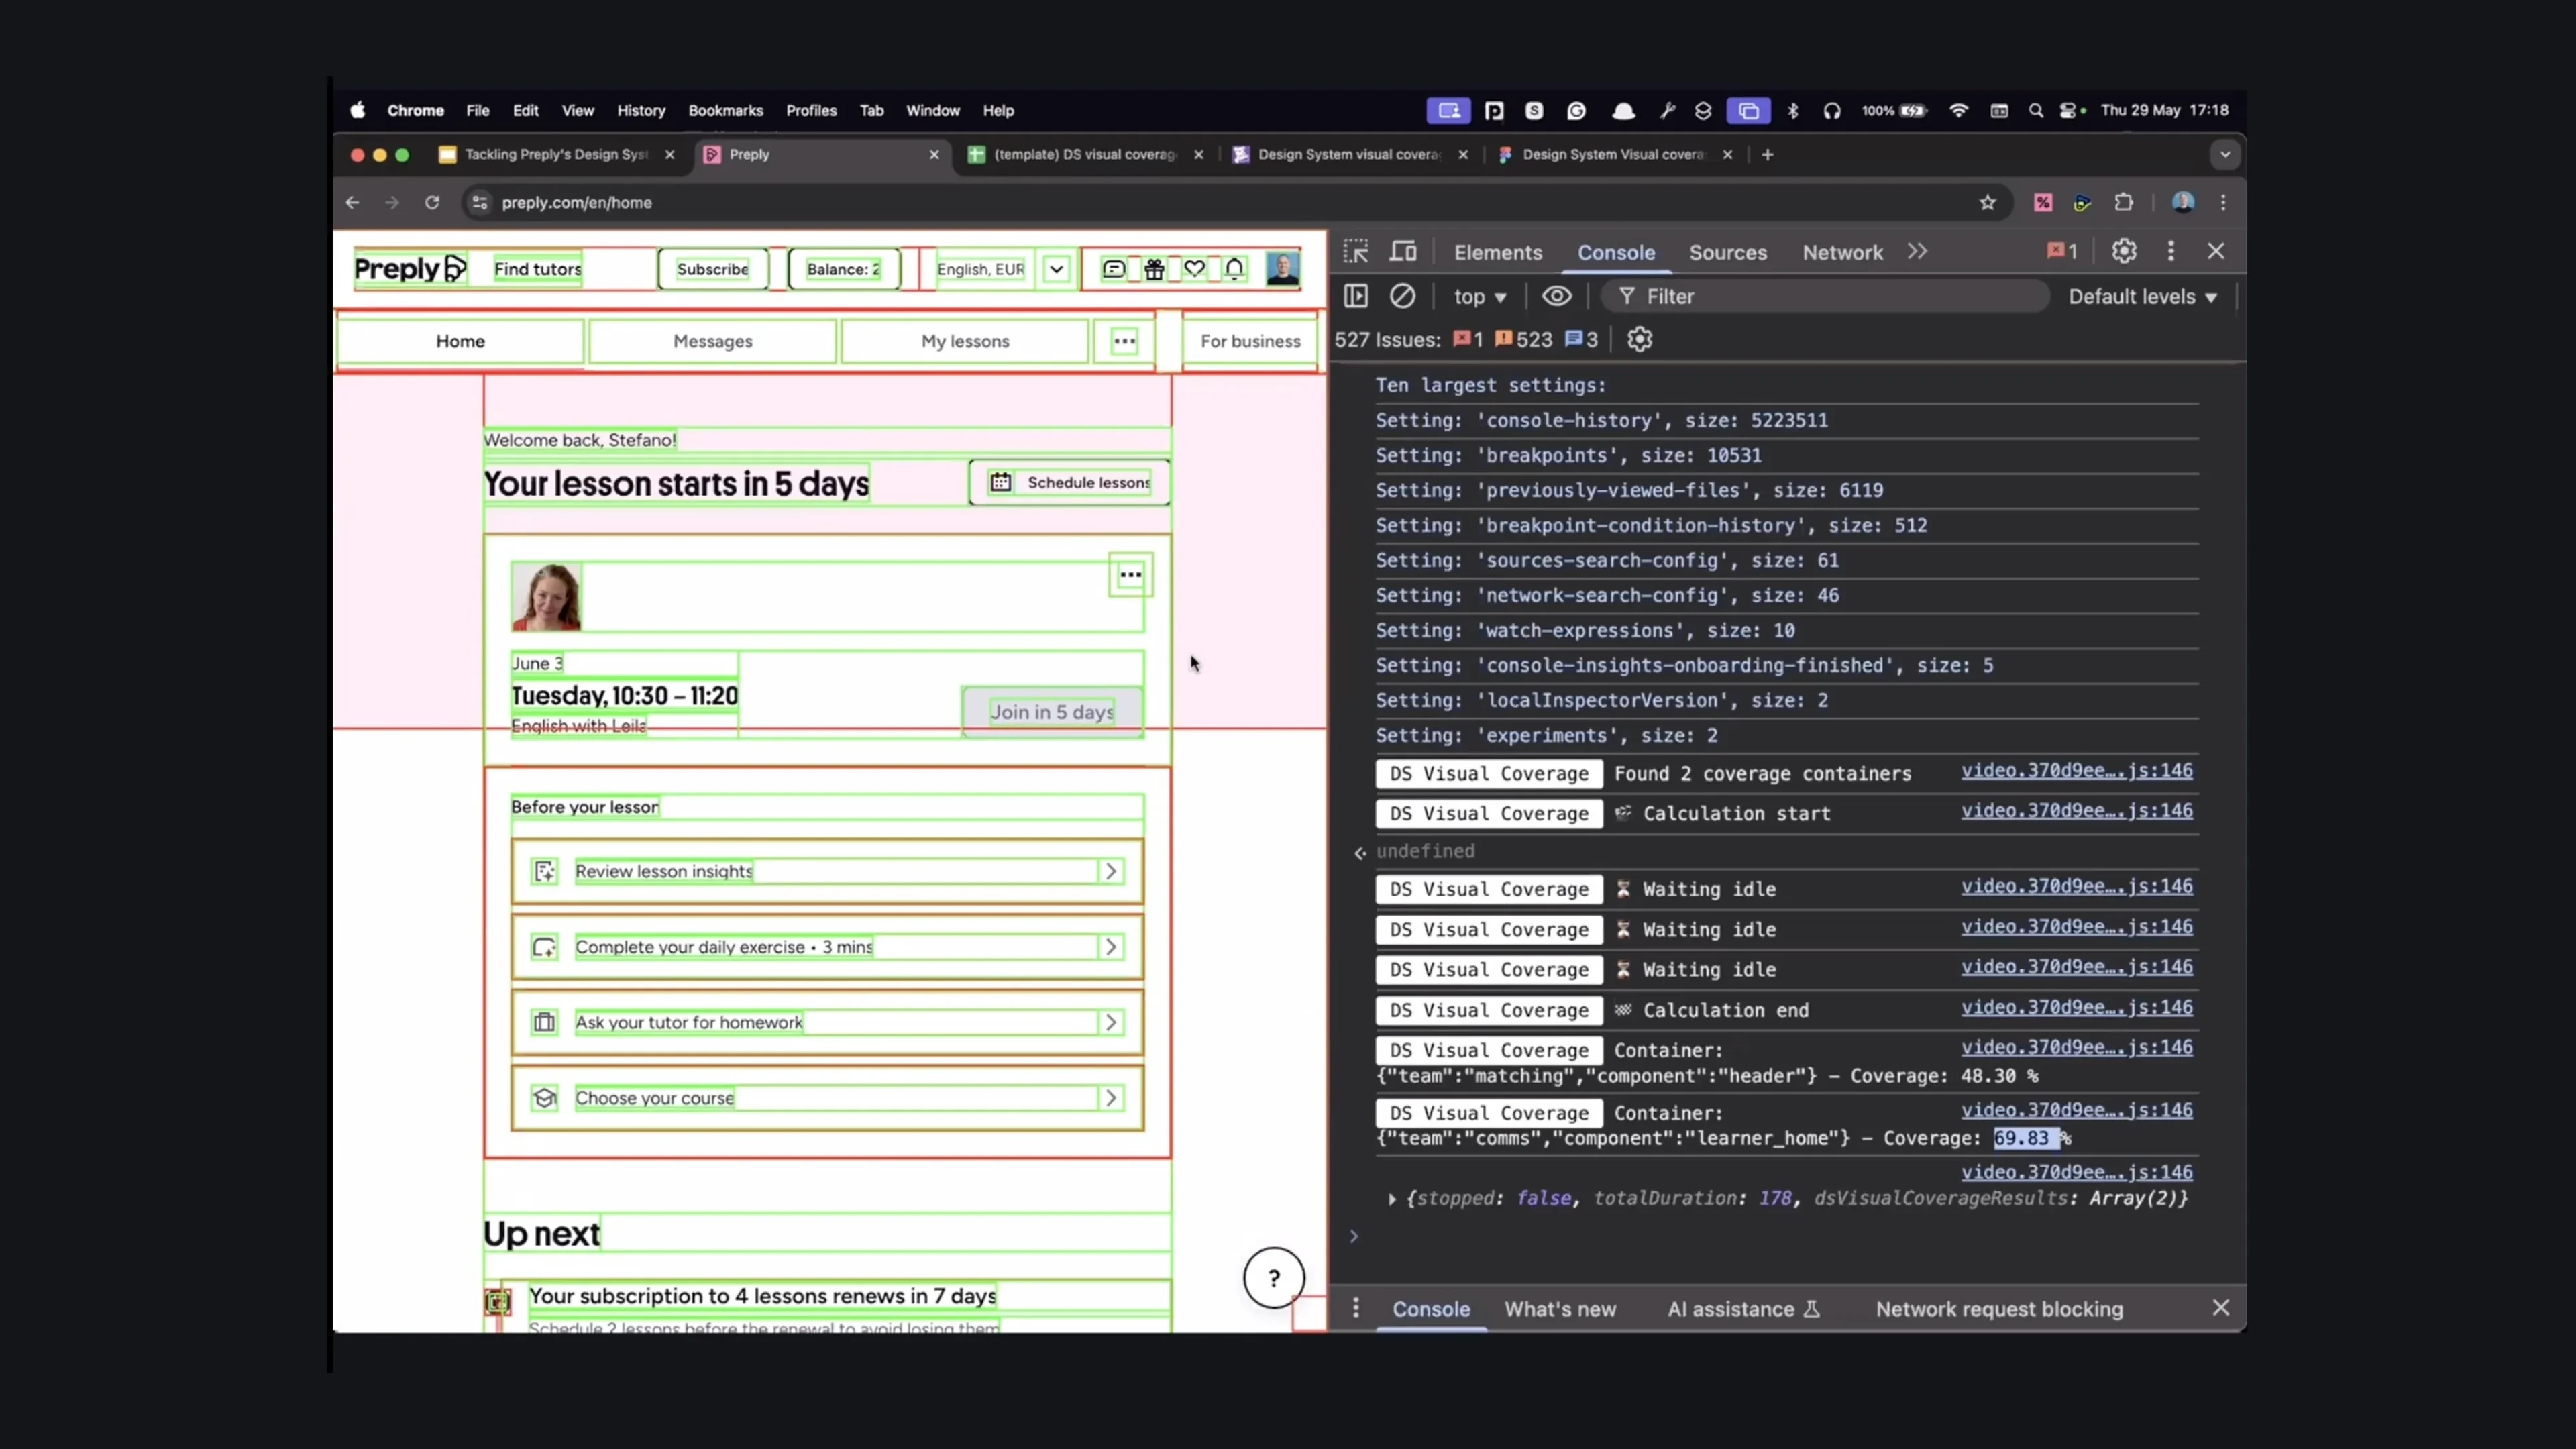
Visual Coverage is a browser based algorithm that runs directly on user devices.
It calculates how much of a page is composed of Design System components by analyzing rendered pixels, not code or DOM structure.
Imagine coloring every Design System component green and every non system component red.
Then calculating the percentage.
That is the core idea.
This makes the metric:
- Product oriented
- Real time
- User perspective driven
It shows Design System adoption the way real users see it.
Why Preply built it
Stefano explained the problem clearly:
"Design System metrics like token usage or static analysis are good, but they do not speak the same language as product teams."
Leadership speaks in product data:
conversion, engagement, retention, flow completion.
Preply needed a metric that:
- reflects real user experience
- highlights areas where the Design System is strong
- shows where the system is not helping enough
- guides roadmaps and investment
- supports conversations with leadership
So they built their own metric and made it open source.
How Visual Coverage works
Here is what makes it unique:
✔ Pixel based analysis
It measures screen real estate occupied by Design System components.
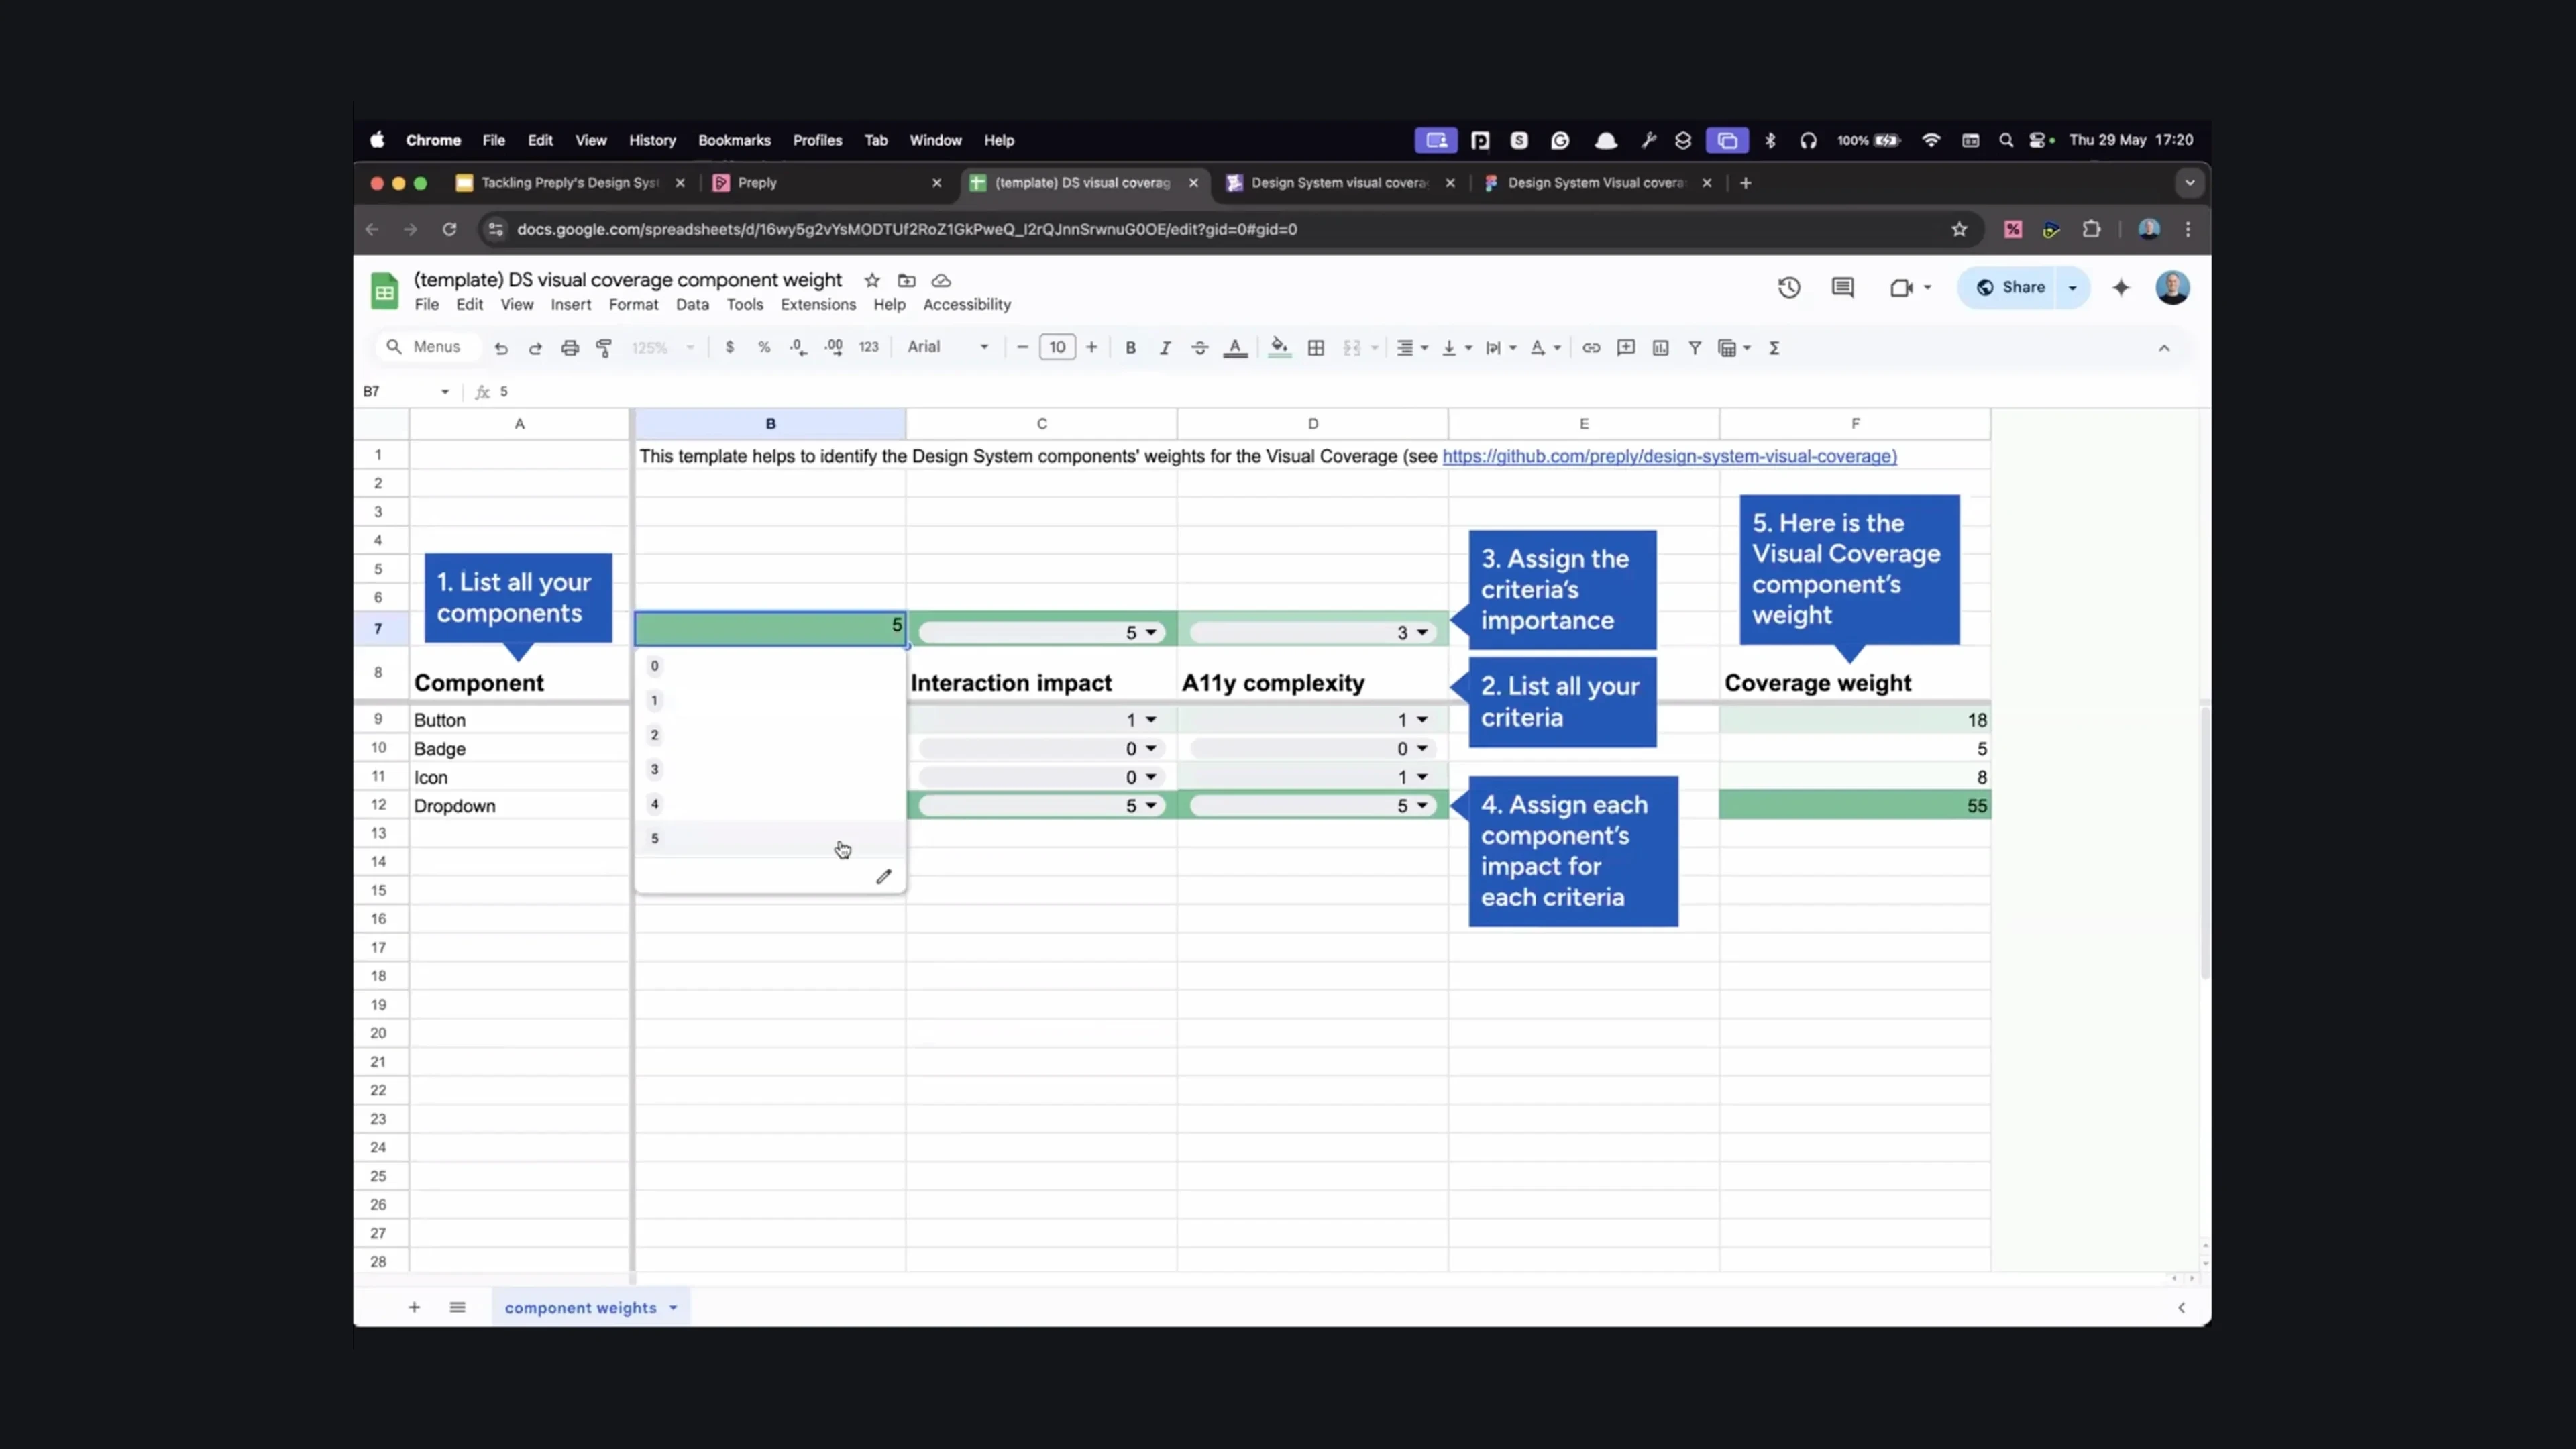
✔ Component weighting
Not all components are equal.
A primary button matters more than a layout div.
Preply built a scoring model based on UI impact, interactivity and accessibility.
✔ Team level insights
Adoption is tracked by product team, flow or domain, showing where support is needed.
✔ Live dashboards
Preply collects more than 300,000 measurements per day across their product.
✔ Framework agnostic
The algorithm runs in plain JavaScript and works across tech stacks.
There is even a spreadsheet and Figma starter file to help teams get started.
What Visual Coverage enables
- Clear dashboards that show system adoption
- Insight into which teams are using the system and which are not
- Better prioritization: build more components or improve the ones you have
- Stronger alignment with leadership
- The ability to support OKRs and adoption goals
- A real world signal of Design System usefulness
Because the algorithm runs on user devices, coverage scales automatically across the entire product.
No custom tracking code needed.
How you can try it
Here are concrete next steps if you want to explore Visual Coverage:
- Check out the open source library
- Build a simple component weighting model for your system
- Test the metric on core flows or high traffic pages
- Track adoption across teams or product areas
- Use insights to inform your roadmap or governance model
As Stefano put it:
"Visual Coverage is not a judgment metric. It is a success metric."
It is about understanding where your system helps and where it does not yet.
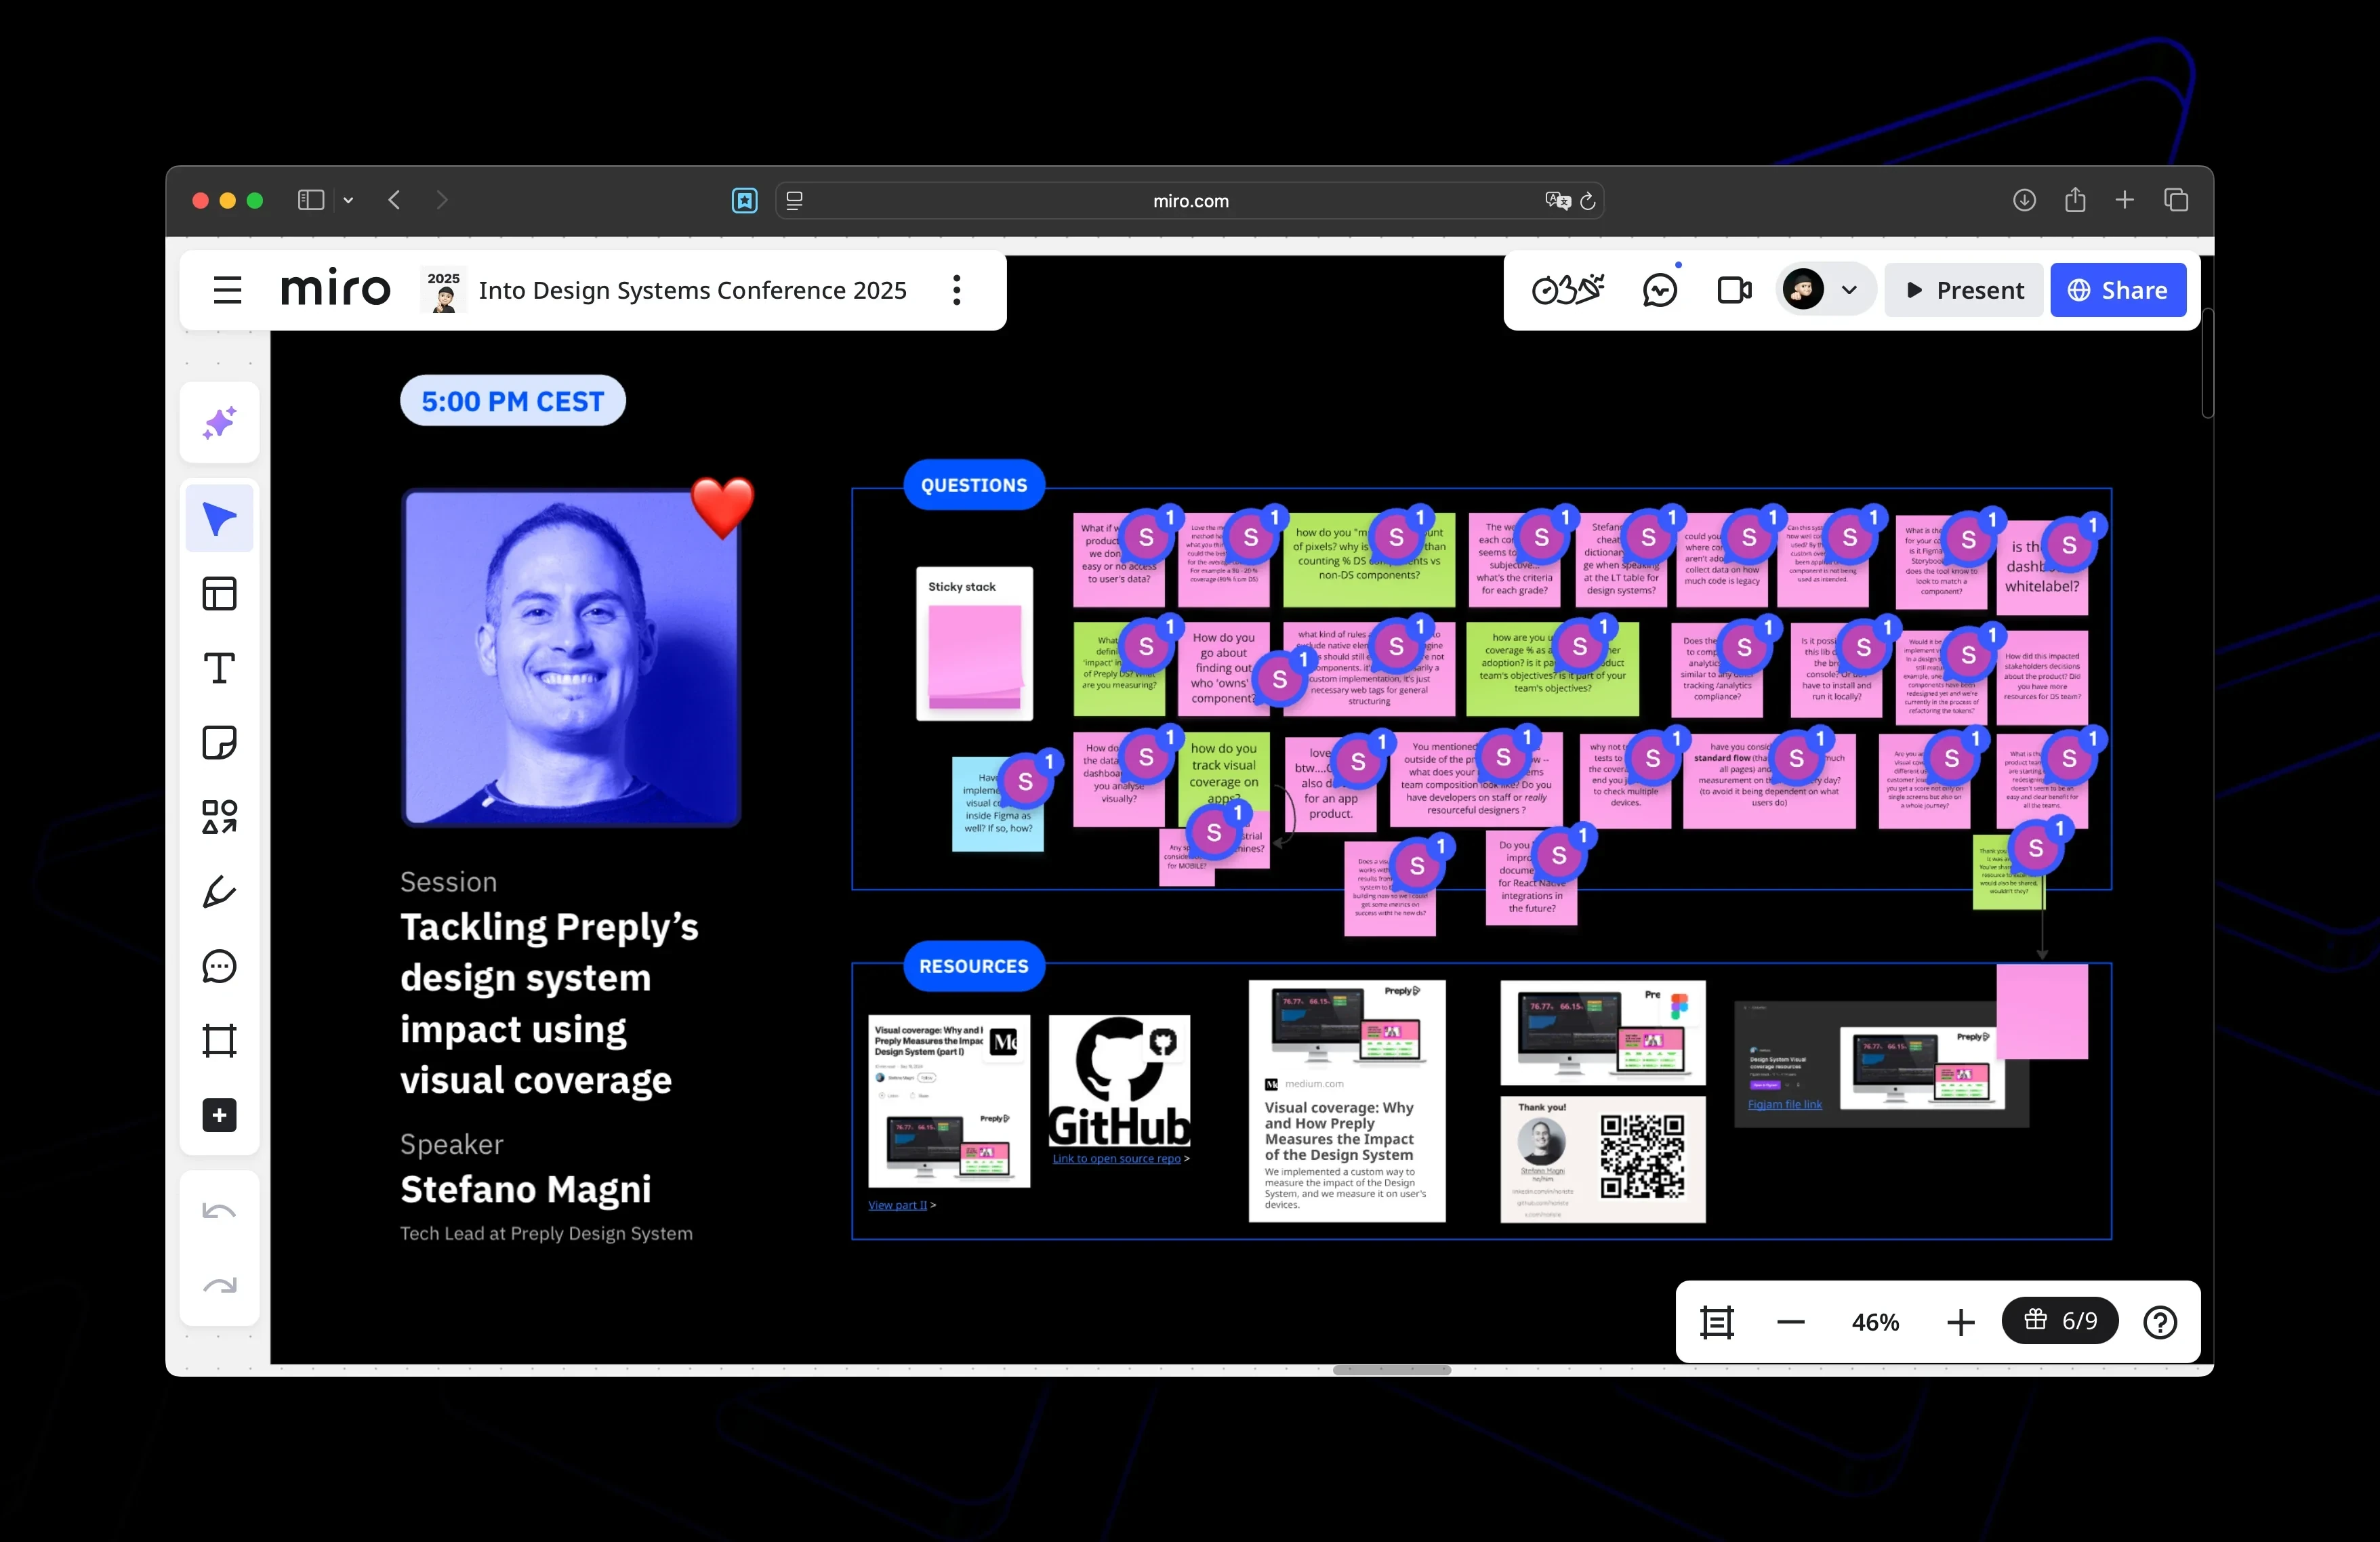
Get the resources, templates and Miro access
After the talk, Stefano shared even more resources inside the official Into Design Systems Conference Miro board.
He also answered follow up questions from the community, including:
- What if we work in environments with little or no access to user data
- How do you define "impact" in the context of Preply's Design System
- How do you measure Visual Coverage on mobile apps
- How do you use the percentage to drive adoption
- Is it part of product team goals or Design System team goals
Want to go deeper and learn everything Stefano shared
You will get access to:
- the full session recording
- the shared Miro board
- slides, templates and code examples
- resources from more than 20 expert sessions
Learn about Design Systems, Design Tokens, Accessibility, Documentation and more.
👉 Get instant access to all recordings and resources
The resources are exclusive to attendees and packed with real world examples you can use right away.